Botanic Pet
Created by
Weizhe Zhao (wz333) and Qingyuan Xie (qx95).
Demonstration Video
Introduction
This project was created by Weizhe Zhao (wz333) & Qingyuan Xie (qx95) for Cornell’s ECE 5725 Fall 2023. The objective was to create a mobile app that transforms an ordinary houseplant into an interactive pet. The app visualizes the plant's emotions based on sensor measurements, including humidity and temperature of the air, soil moisture level, and ambient light conditions. Additionally, the app provides remote control over a camera for monitoring the plant. At the project's core is a progressive web app built using Python Flask, and the essential sensor data are sourced from a plant monitor and an LDR light sensor.
Project Objective:
- Create a mobile app that displays the status of the houseplant.
- Interpret the plant’s emotions based on sensor measurements.
- Control the camera from remote that can display a live feed of the plant.
- Design a PiTFT GUI to run and stop the web server.
Design

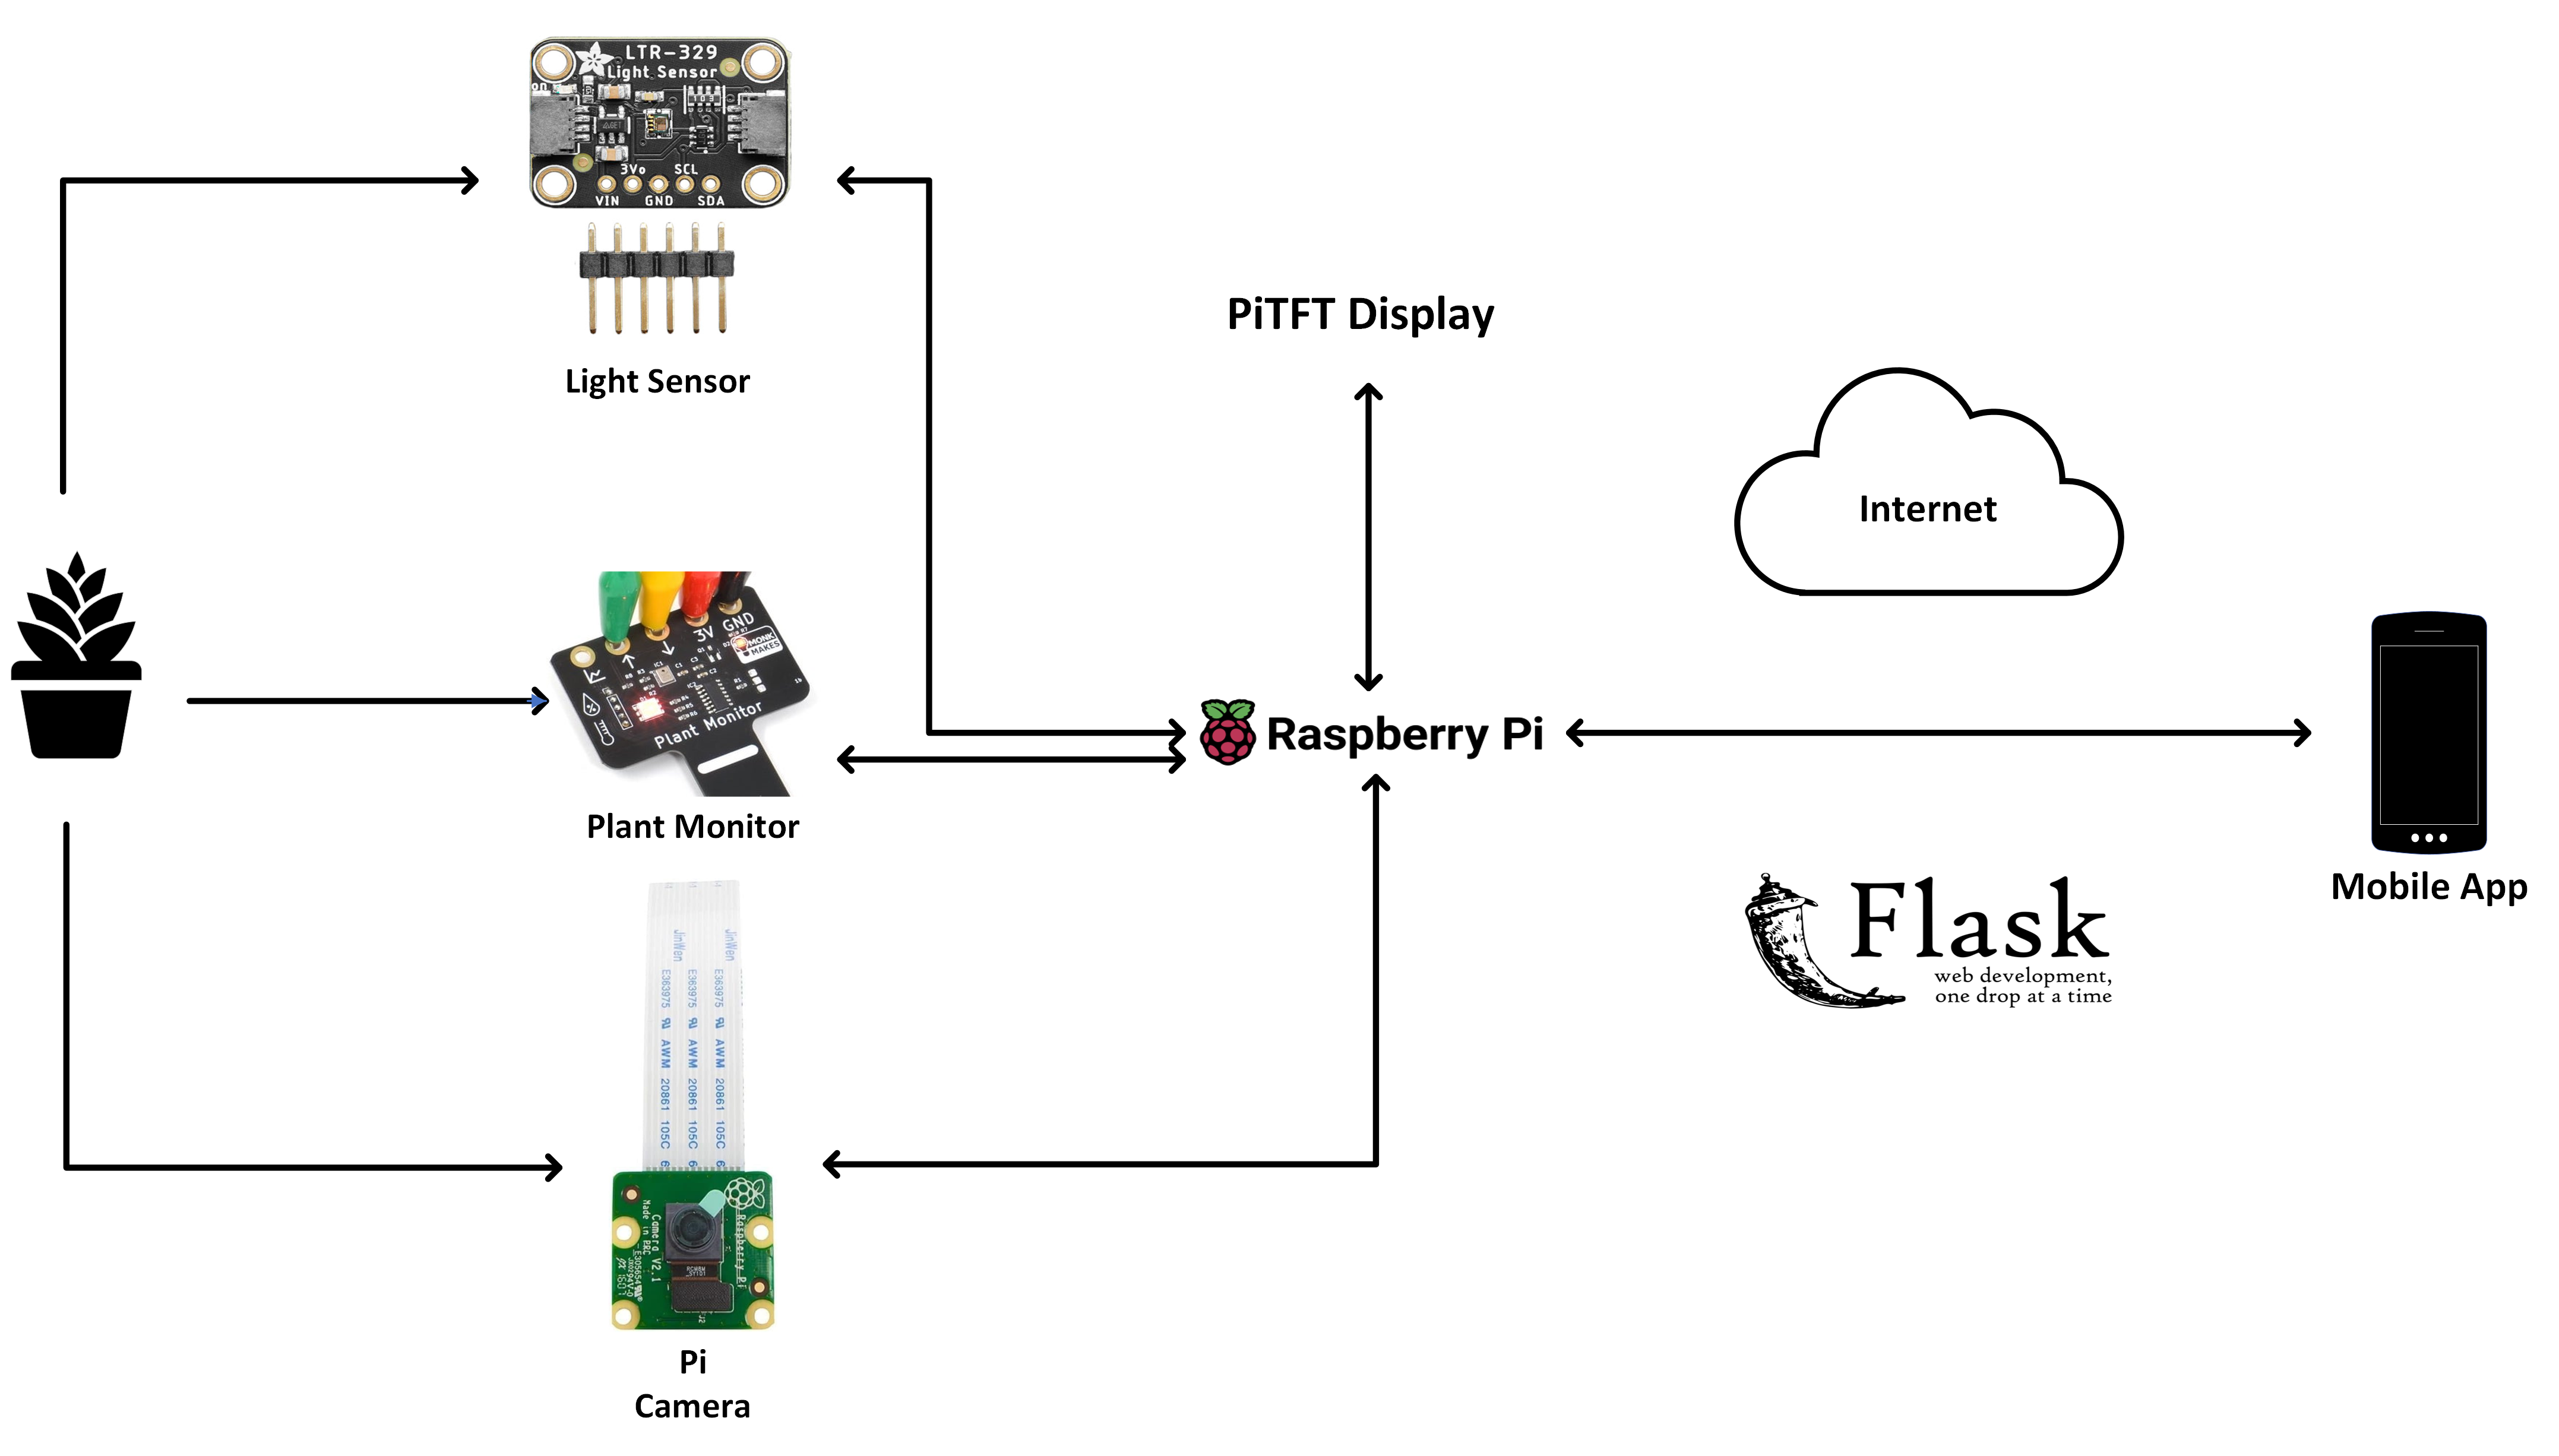
System Diagram
Progressive Web App (PWA)
The mobile app was realized with a progressive web app. The design integrates Python Flask for backend logic, HTML, CSS, and JavaScript for frontend development, JSON for data interchange, and nGrok for routing capabilities.
The Flask framework serves as the backend infrastructure. We chose it to build the server-side logic for its simplicity and versatility. The frontend is crafted using a combination of HTML, CSS, and JavaScript to create a dynamic and responsive user interface. HTML defines the structure of the app, CSS styles enhance its visual appeal, and JavaScript adds interactivity.
In terms of communication between the frontend and backend, JSON (JavaScript Object Notation) is employed as the data interchange format. JSON is well-suited for transmitting structured data, ensuring efficient and standardized communication between different components of the application. This enables us to transfer the sensor data between the server (RPi) to the frontend (user’s end). For Internet access, we used nGrok to expose the local server to the public network.
Plant Monitor
Monk Makes plant monitor module measures soil moisture, temperature and relative humidity. By connecting the plant monitor and RPi, setting the RPi Serial Port and Serial Console properly, and downloading the example programs, it’s very convenient to use the function to obtain the plant’s data. The sensor will collect data periodically, with a constant interval that we set as 3 seconds. Moreover, the wetness can be seen roughly by observing the built-in LED. Red means dry, and green means wet.
The connections are:
- GND to GND
- 3.3V on the Raspberry Pi to 3V on the Plant Monitor
- 14 TXD on the Raspberry Pi to RX_IN on the Plant Monitor
- 15 RXD on the Raspberry Pi to TX_OUT on the Plant Monitor
Light Sensor
For the light sensor module, we chose to use the TSL2591, which is a very powerful light sensor capable of measuring total, infrared, visible, and full-spectrum (infrared + visible) light. However, as ECE majors and not botany majors, we do not study the effects of different types of light on plant growth. For us, the total light value is enough.
Here's the connection Raspberry Pi wired with I2C:
- Pi 3V3 to sensor VIN
- Pi GNG to sensor GND
- Pi SCL to sensor SCK
- Pi SDA to sensor SDA
PiCamera
After installing the PiCamera to the camera module port on the Raspberry Pi computer and enabling the camera on the RPi setting, we utilized the streaming feature that allowed us to observe the plants in real time and changed the screen size to fit the dimensions on the app.
Plant Datasheet
We made a datasheet that contains several kinds of plants’ minimum and maximum wetness, temperature, humidity, and light intensity.
| min wetness (%) | max wetness (%) | min temperature (F) | max temperature (F) | min humidity (%) | max humidity (%) | min light intensity (LUX) | max light intensity (LUX) | |
|---|---|---|---|---|---|---|---|---|
| mint | 30 | 60 | 65 | 70 | 50 | 10000 | 400 | 1000 |
| Succulent | 10 | 30 | 60 | 80 | 40 | 50 | 1500 | 10000 |
| Sansevieria-Superba | 30 | 60 | 59 | 73 | 40 | 40 | 1000 | 2000 |
In the demo, we used a succulent as an example. It’s very easy to make our botanic pet fit other plants by modifying our program to read another row of this data. For future optimization, we can consult with botanists to get larger and more accurate plant data and expand the applicability of our Botanic Pet.
Testing
The testing phase of the involved sensor measurements and mobile app functionality. We first made experiments on the sensors to make sure they function well and can transmit their measured data (humidity, temperature, soil moisture, and light values) to RPi. Below is the testing results of the plant monitor:

The app's ability to visualize the plant's emotions based on these sensor readings was tested under various environmental scenarios. Additionally, the remote control of the camera, enabling users to monitor the plant, underwent extensive testing for reliability. The Progressive Web App (PWA) core, built on Python Flask, was assessed for responsiveness and consistent performance across devices and browsers. Integration tests confirmed the seamless communication and processing of sensor data. Usability testing provided valuable insights into the user interface and overall experience, ensuring a successful implementation.
Result
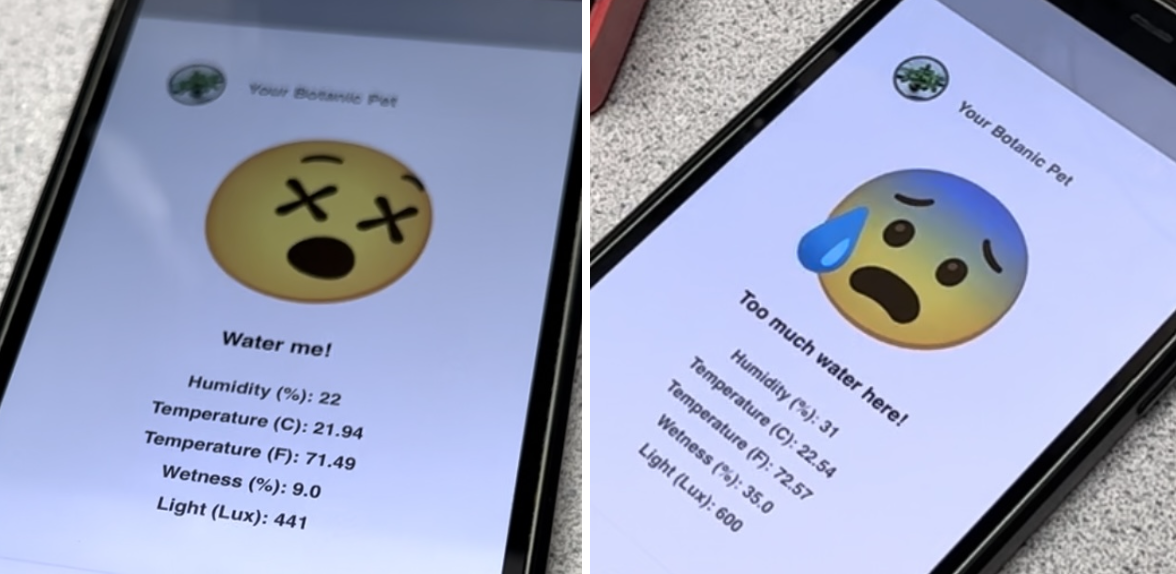
We used a succulent for demonstration. According to our research[ref], it has a comfort zone with temperature of 60F to 80F, soil moisture of 10% to 30% … Based on these data, different emotions are displayed under corresponding circumstances indicating the status of the pet.
If the temperature is too low, the app shows an emoji expressing cold along with text that tells you how the pet is feeling now. When it gets above the comfort level, the ‘hot’ emoji is triggered.

Correspondingly, plant pets also have emojis for very dry or very wet soil conditions. The wetness requirement for the chosen plant succulent is 10-30%. You can see that when the wetness is outside the comfort zone shows the plant status and text telling it what it wants you to do.

When there is not enough light, plant pets are in "sleep mode", as if night has come. When everything is just right, the app shows a happy emoji with text saying the pet is doing great.

By tapping 'on/off' on the app, we can see the plants and their surroundings in real time from a remote location.

Work Distribution

Weizhe Zhao
wz333@cornell.edu
Overall software architecture design; PWA GUI Design; Software implementation; Website creation.

Qingyuan Xie
qx95@cornell.edu
Circuit and device layout; Sensors and camera configuration and testing; Plant data collection and organization.
Parts List
- Raspberry Pi - $35
- Raspberry Pi Camera V2 - $25.00
- TSL2591 Light Sensor - $6.95
- Monk Makes Plant Monitor - $9.95
- Succulent - $2.99
- LEDs, Resistors and Wires - Provided in lab
Total: $79.89
References
[1] A Flask PWA Template[2] NGrok - Unified Ingress Platform for developers
[3] PiCamera Document
[4] Important Tips and Care Guide For Growing Mint Plants
[5] How to Care for the Succulents You Grow Indoors